
Summary:
Automatically measured at the machine source, these rates reveal hidden losses and often increase OEE from 60% to 80%.
The difference between OEE, OOE, and OTE lies in the measured time frame.
The OEE evaluates the machine based on its planned operating time (pure productivity), the OOE adds planned downtimes to the opening time (maintenance, meetings, breaks), and the OTE relates production to total calendar time (24/7). Together, they precisely locate your losses.
1.Three indicators to drive the performance of your workshop
In a machining workshop, data is no longer an option: it is a lever of competitiveness. At Atsora, we transform the raw signals from your machine tools into actionable performance indicators. Understanding the performance of your workshop begins with mastering three key indicators, whose hierarchy allows you to pinpoint exactly where your losses are (organizational, technical, or quality).
OEE (Overall Equipment Effectiveness)
It measures the efficiency of the machine during its planned operating time. It is the indicator of pure productivity, the one that assesses the efficiency of the team and the process.
Example: If your machine is scheduled for 8 hours but experiences 1 hour of micro-stops and produces 3% scrap, your OEE will drop, revealing an operational issue.
OOE (Overall Operational Effectiveness)
It incorporates the opening time of your factory, including planned downtimes (maintenance, meetings, breaks)
Example: A workshop operating in 2x8 will have an OOE influenced by periods when the machine is available but not loaded due to lack of personnel or preventive maintenance.
It is the benchmark indicator for identifying availability losses and driving actions aimed at reducing machine breakdowns.
The TEEP (Economic Yield Rate)
It relates production to the total theoretical time (24/7).
Example: For a heavy investment, the TEEP allows you to visualize whether your asset is being utilized to its maximum calendar potential.
It is the indicator to use when you want to operate machines without an operator, for example at night, on weekends, or during non-working periods.
👉 Want to know which KPI reveals your real production losses? Talk to our experts.
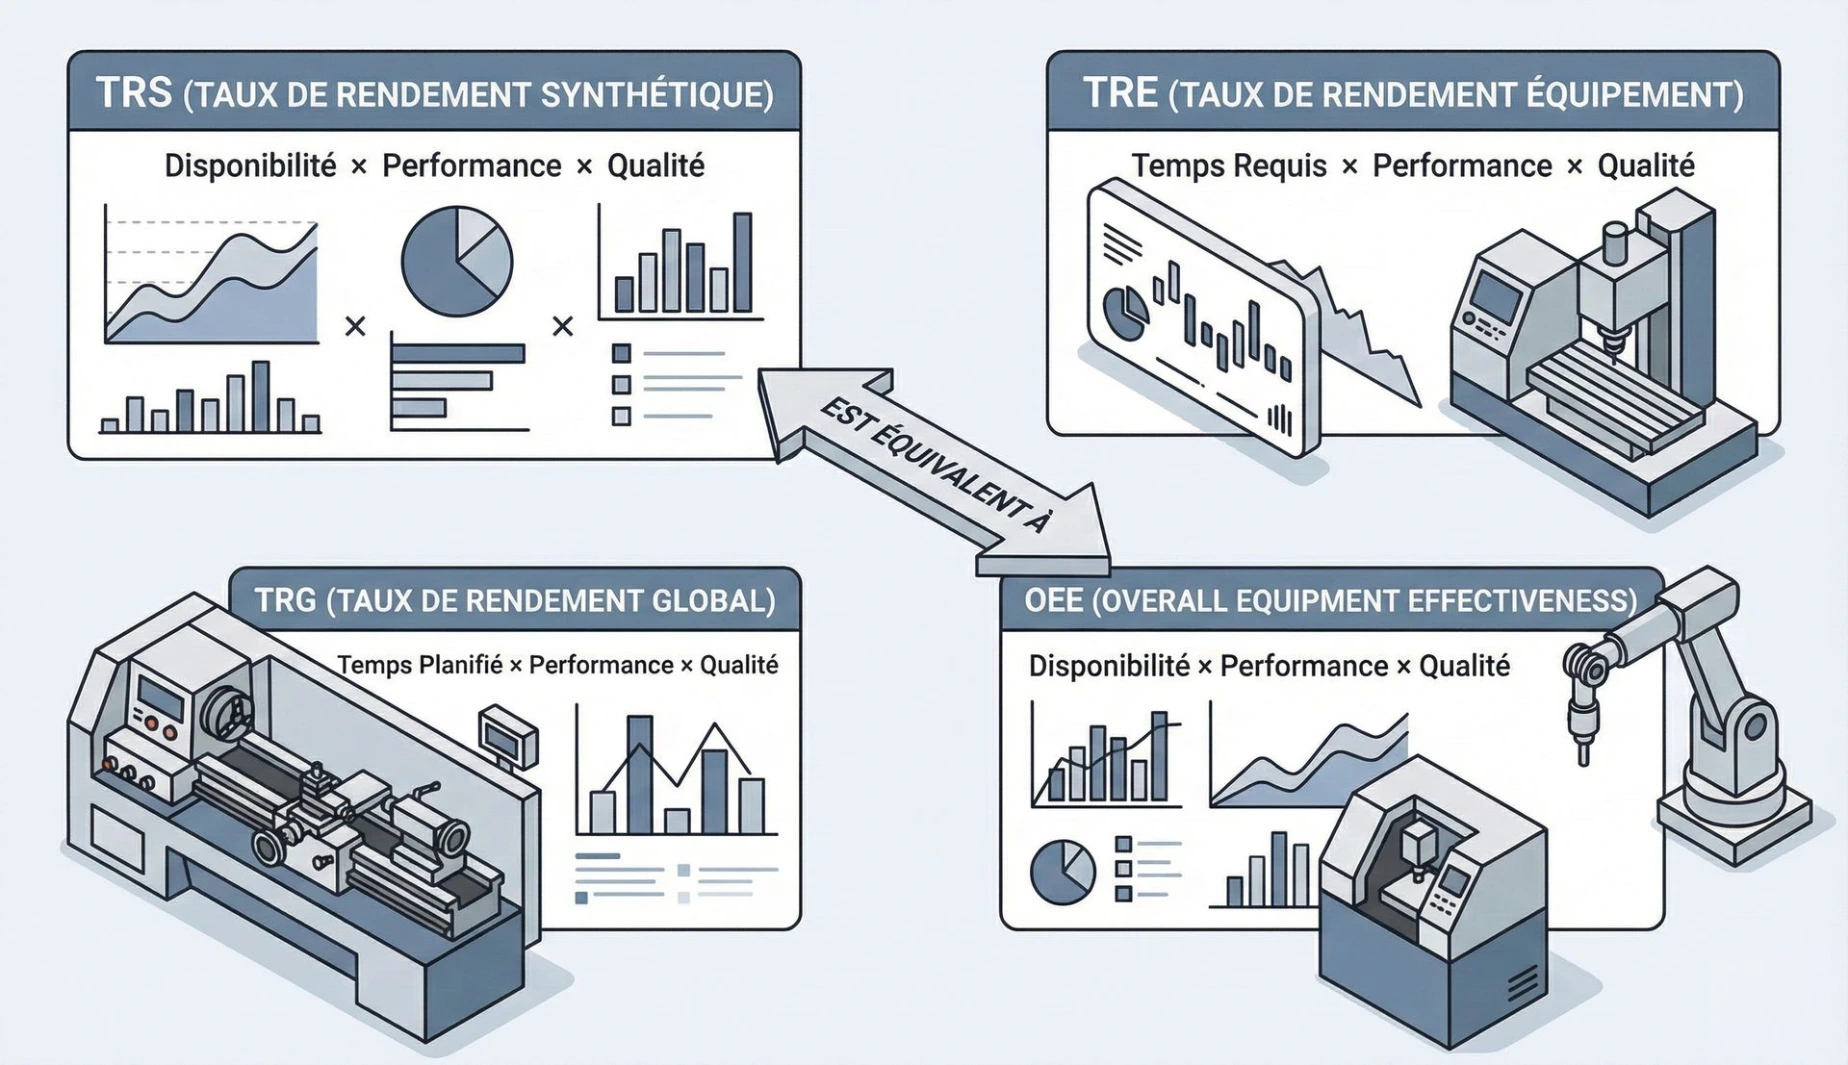
Explanatory diagram TRS, TRE, TRG, OEE
2. The Atsora Tracking Approach: Source data, without compromise.
Most market solutions rely on manual operator input. At Atsora Solutions, we differentiate ourselves through a direct connection to PLCs, ensuring total data integrity.
Depending on the nature of your production, our Atsora Tracking solution calculates your performance using two innovative methodologies:
A. Analysis by Machining Cycles (Process Excellence)
This method is the most accurate for high-tech industries. It compares in real-time each cycle captured on the CNC to the standard cycle time.
The concept:If a milling cycle is scheduled for 4 minutes but takes 4 minutes and 20 seconds, Atsora automatically detects the entire cycle, from start to finish, and immediately identifies an 8% deviation.
The Atsora advantage: We automatically isolate and exclude non-productive periods (loading/unloading) to only assess the actual performance of your cutting conditions.
B. Analysis by Machine Status (Availability & Flow Vision)
Ideal for high mix, low volume workshops, this mode examines the actual state of the machine:Production, Stop, Alarm, or Adjustment.
The concept:Without any human action, the system records a machine state that can then be supplemented by an automatic classification of the stop.
The Atsora advantage: You gain an objective view of the causes of non-productivity. This allows for the initiation of SMED or logistical projects based on facts, not estimates.
3. Why does Atsora redefine the standards of Performance Audit?
Unlike traditional "paper" approaches or rigid MES software, Atsora offers superior technological agility:
- Direct connection to the machines for an optimal reliability of data.
- Real-time alerts and dashboards for better responsiveness.
- Precision to the second in your data. Quick and non-intrusive
- implementation. Atsora's commitment:
We do not just deliver a rate: we provide the necessary visibility to turn every lost minute into a margin gain opportunity, with automatic classification of stops that immediately qualifies losses and accelerates corrective actions.
👉 Ready to measure your OEE without operator input? Request a demo on your machines.
To remember
- The TRS measures machine productivity over the planned production time; TRG and TRE expand the time scope.
- OEE, OOE, and TEEP are the English equivalents of TRS, TRG, and TRE.
- The operator's declaration forgets micro-stops: automatic measurement at the source is much more reliable.
- Atsora calculates performance by machining cycles or by machine status, depending on your production.
- A comprehensive measure often advances the OEE from 60% to 80%.
Digitize your performance today
Stop running your machine tools in the dark. With Atsora Tracking, you gain an objective, actionable view of your OEE, OOE and TEEP. Request an Atsora Tracking demo and uncover the hidden losses in your own production processes.
TRS (Synthetic Yield Rate) is simply the French term for OEE (Overall Equipment Effectiveness). At Atsora Solutions, our interfaces are bilingual and adapt to international standards (AFNOR NF E60-182) to ensure smooth communication within your global teams.
The reporting relies on manual entries, often done at the end of a shift and from memory, which generates forgotten micro-stops. Atsora directly queries the machine to the second, cross-references CNC flows and machine states, then processes them to qualify stops and drifts. Human error disappears.
Yes. Thanks to our connectivity solutions (IoT or native protocols), we capture production signals even on heterogeneous fleets, to centralize your OEE on a single dashboard.
The global average is around 60%. An OEE of 85% is considered world-class excellence (World Class Manufacturing). Our role: to help you identify the 15% or 20% of hidden losses. In practice, our clients often progress from 60% to 80%.
The standard time is your theoretical reference (manufacturing range). The real time is the duration measured by Atsora for each part. The gap constitutes the "performance loss," which our algorithms analyze to alert you in time.
Start with OEE to manage productivity on a daily basis. ORE informs your organizational decisions (opening, scheduling), RTE your investment choices. Atsora allows you to track all three on the same dashboard.